The Challenge: Manual Data Processing in Hazardous Area Certification
For manufacturers seeking ATEX or IECEx certification for electrical equipment destined for hazardous locations, temperature rise testing represents a critical, and often tedious, compliance requirement. The test verifies that equipment surface temperatures and internal component temperatures remain within safe limits specified by temperature class ratings (T1 through T6), preventing potential ignition sources in explosive atmospheres.
The traditional workflow involves hours of data collection using precision data acquisition systems, followed by manual processing of thousands of temperature readings, statistical analysis, and report generation for certification bodies. For control panel manufacturers and OEMs, this process creates a significant bottleneck between design validation and certification approval.
Understanding Temperature Rise Test Requirements
ATEX (European) and IECEx (International) standards mandate comprehensive temperature rise testing for equipment intended for use in potentially explosive atmospheres. The testing protocol requires:
Monitoring Multiple Temperature Points: Control panels typically require 10 or more thermocouples strategically placed at critical locations like feed terminals, external surfaces, internal components, transformers, overload relays, and starter assemblies. Each location must demonstrate compliance with the equipment’s designated temperature class.
Extended Test Duration: Tests typically run until thermal equilibrium is reached, often requiring several hours of continuous monitoring at ambient conditions plus the maximum rated ambient temperature.
Statistical Rigor: Certification bodies require documented proof of maximum temperatures, temperature ranges, stability verification, and traceability to calibrated instruments. The data must demonstrate that the equipment remains below the maximum surface temperature for its classification (e.g., 135°C for T4 rating).
Comprehensive Documentation: Test reports must include project identification, equipment specifications, test conditions, calibration certificates, complete temperature profiles, statistical analysis, and formal sign-off by qualified personnel.
The Traditional Workflow: Manual and Time-Intensive
A typical temperature rise test workflow using the Keysight 34970A Data Acquisition Unit with Agilent BenchLink Data Logger 3 software involves several manual steps:
- Configure the data logger for 10+ thermocouple channels with appropriate sampling intervals
- Run the test for 5-6 hours until thermal equilibrium is achieved
- Export raw data from the BenchLink software (UTF-16 CSV)
- Manually open the CSV in Excel and convert encoding to UTF-8
- Clean header rows and formatting inconsistencies in the raw data
- Calculate min/max values for each channel
- Compute temperature statistics across all sensors
- Generate individual temperature profile charts for each measurement location
- Format tables and apply highlighting to critical values
- Create the final certification report with proper formatting and sign-off sections
- Print or PDF the report for submission to the certification body
This process typically consumed 2-3 hours of engineering time per test, not including the actual test duration. For projects requiring multiple iterations during design optimization, this overhead becomes substantial.
The Solution: Purpose-Built Excel VBA Macro System
A macro-enabled Excel workbook was developed that automates nearly the entire post-test workflow, reducing the manual processing time from hours to minutes. The system consists of two primary automation routines: data cleaning and report generation.
Automation Capabilities
Data Cleaning
| Automation Feature | Technical Implementation | Value Delivered |
| Encoding Conversion | Addresses incompatibility between Agilent BenchLink’s UTF-16 CSV export and Excel’s UTF-8 format | Eliminates manual file conversion step |
| Header Row Removal | Strips first four metadata lines from data logger output while preserving column headers (Scan, Time, Elapsed, channel names) | Ensures clean data structure for analysis |
| Time Format Standardization | Extracts hours, minutes, seconds from raw timestamps; applies VBA TimeValue function to standardize to HH:MM:SS format | Enables consistent time-series charting and accurate interval calculations |
| Delimiter Standardization | Applies quoted comma formatting throughout file | Ensures proper multi-column interpretation even with special characters in channel names |
| Output Management | Automatically saves as “cleaned_data.csv” in same directory as source file | Ready for immediate analysis without file navigation |
Report Generation
| Automation Feature | Technical Implementation | Value Delivered |
| Intelligent Data Analysis | Automatically processes all temperature channels (10+); calculates min, max, range, average, and standard deviation per channel plus global statistics | Eliminates manual statistical calculations and reduces error risk. |
| Test Duration Calculation | Analyzes timestamps to compute total test duration and average sampling interval | Validates thermal equilibrium achievement and proper DAQ configuration |
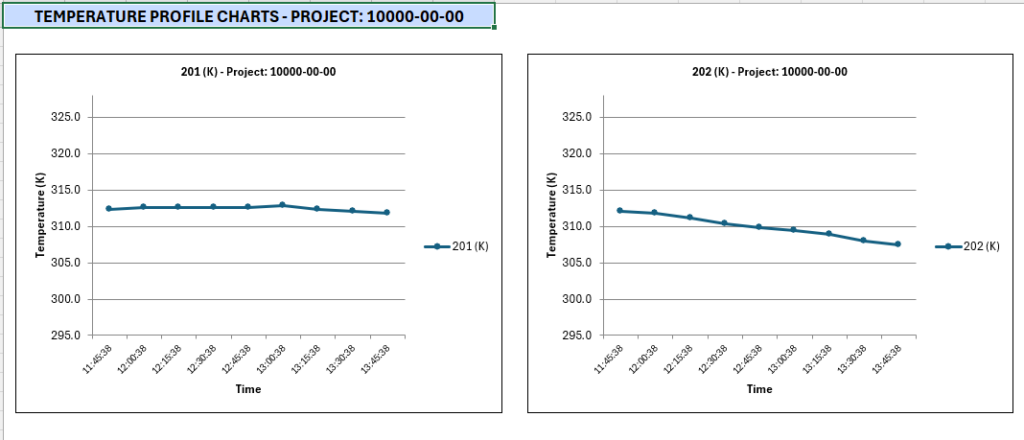
| Automated Visualization | Generates individual line charts for each channel with common Y-axis scaling and professional formatting | Immediate visual identification of hot spots and temperature profile anomalies |
| Intelligent Highlighting | Applies conditional formatting: light red for global minimum, light yellow for global maximum | Enables rapid identification of critical values for certification reviewers |
| Professional Formatting | Includes project header, test parameters, global statistics, channel analysis table, legend, and verification sign-off section | Delivers all elements required by certification bodies in single document |
| Print-Ready Output | Configures page layout, print areas, headers, footers, and margins automatically | Direct printing to PDF without additional formatting for notified body submission |
The operator’s role is reduced to three simple inputs: entering the project number (format: #####-##-##), selecting the raw CSV file for cleaning, and selecting the cleaned CSV file for report generation. Everything else happens automatically.
System Architecture: Integration with Data Acquisition Hardware
Hardware Layer
- Keysight 34970A Data Acquisition / Data Logger Switch Unit
- Type K or Type T thermocouples positioned per IEC 60079 guidance
- RS-232 to USB interface cable for PC communication
Software Layer
- National Instruments VISA drivers (prerequisite for instrument communication)
- Agilent BenchLink Data Logger 3 software (instrument control and data collection)
- Custom Excel VBA macro workbook (data processing and report generation)
The separation of data acquisition and post-processing provides important flexibility. Engineers can monitor tests in real-time using BenchLink’s live displays, while the automated reporting runs offline after test completion. This architecture also preserves raw data files for audit trails and regulatory compliance
Beyond Temperature Rise Testing: The Case for Data Processing Automation
This temperature rise test solution exemplifies a broader opportunity in industrial testing and quality control: automating the “last mile” between data acquisition and actionable reporting.
The Automation Sweet Spot:
Many engineering workflows involve sophisticated instrumentation that generates excellent raw data but lacks flexible reporting. Data acquisition systems, spectrum analyzers, vibration monitors, material testing equipment, and environmental chambers all produce CSV or ASCII output that requires manual post-processing. Excel VBA macros occupy a unique position in this ecosystem. They are powerful enough for complex calculations and formatting, yet accessible to engineers without formal programming backgrounds.
Scalability Through Templates:
Once developed for one project, macro-enabled workbooks become reusable templates. Our temperature rise test solution works for any channel configuration as long as the CSV is generated with the same output data structure. The same approach applies to other repetitive test protocols: vibration qualification per IEC 60068-2-6, IP rating verification, dielectric strength testing, or EMC/EMI measurements.
Validation and Traceability:
Automated data processing actually improves regulatory compliance compared to manual methods. The macro code represents a documented, repeatable process that eliminates transcription errors and calculation mistakes. For quality management systems (ISO 9001, AS9100), the version-controlled workbook serves as a validated procedure, while the generated reports provide objective evidence of testing.
Integration with Existing Tools:
Excel’s ubiquity makes it ideal for automation in industrial environments. Engineers already use it daily, IT departments support it, and it integrates seamlessly with existing workflows. There’s no need to purchase specialized software, configure database connections, or maintain web servers. The macro workbook can be distributed to multiple test stations or shared with contract testing labs without licensing concerns.
Measurable Results and ROI
Time Savings:
The automated system reduces post-test processing from 2-3 hours to approximately 10 minutes (an 85-90% reduction in manual effort). For a manufacturer conducting 20 temperature rise tests per year, this represents 40-50 hours of recovered engineering time.
Improved Consistency:
Automated calculations eliminate the arithmetic errors and formatting inconsistencies that plague manual report generation. Every report follows the same template, includes the same statistical analysis, and applies the same highlighting rules. This consistency accelerates certification body reviews and reduces requests for clarification.
Faster Certification Cycles:
Professional, comprehensive reports created immediately after test completion enable same-day submission to notified bodies or testing laboratories. This can shorten certification timelines by days or weeks, particularly valuable during product development iterations where multiple design changes require re-testing.
Knowledge Capture:
The macro workbook documents institutional knowledge about report formatting, required calculations, and certification body expectations. New engineers can generate compliant reports without extensive training on testing standards or manual procedures.
Implementation Considerations
Developing effective test automation requires attention to several practical factors:
Understanding Data Source Formats:
Every data acquisition system has quirks (unusual delimiters, embedded metadata, inconsistent time formats, or encoding issues). The key to successful automation is thoroughly analyzing representative raw data files before writing code. I recommend collecting 5-10 actual test files and identifying common patterns and edge cases.
Building in Validation:
Robust macros include error checking at each step. File existence verification, row count validation, column header confirmation, and numeric value range checks prevent processing failures and alert users to data quality issues. Our temperature rise macro verifies that data points exist, confirms the expected column structure, and checks for numeric values in temperature fields.
User Interface Design:
Even powerful automation fails if the interface frustrates users. Simple, clearly labeled buttons, meaningful dialog prompts, and informative progress messages make the difference between adoption and abandonment. Here, the user input was limited to only essential parameters (project number, file selection) while everything else was left to automation.
Documentation and Training:
A brief user guide or quick-reference card eliminates the learning curve. Document the complete workflow, including any manual steps (like the UTF-8 conversion), explain what each button does, and provide troubleshooting tips for common issues.
Future Enhancements and Salability
The current system provides an excellent foundation for expanded capabilities:
Pass/Fail Assessment:
Adding temperature class limit checks (T1 – T6) would enable automatic compliance verification with clear pass/fail indication in the report.
Database Integration:
Archiving test results in a centralized database would enable trend analysis across projects, statistical process control for manufacturing quality, and rapid retrieval of historical certification data.
Conclusion: The Strategic Value of Process Automation
This ATEX/IECEx temperature rise testing solution demonstrates how targeted automation delivers disproportionate value in industrial engineering workflows. By identifying repetitive, error-prone manual tasks and replacing them with validated, reusable code, we transform testing from a time-consuming compliance burden into a streamlined process that supports rapid product development.
The approach scales beyond temperature testing to any scenario where industrial instrumentation produces data files requiring standardized analysis and reporting. The combination of commercial data acquisition hardware with custom Excel VBA automation provides a practical, cost-effective solution accessible to engineering teams without specialized software development resources.
For manufacturers navigating ATEX and IECEx certification, the time savings, consistency improvements, and professional documentation quality justify the modest investment in macro development. More broadly, this project exemplifies the philosophy that automation should serve engineers – taking over tedious tasks while preserving the insight and decision-making that require human expertise.
Does your testing process involve repetitive data analysis and report generation? I develop custom Excel VBA solutions for industrial data processing, test automation, and compliance reporting. From data acquisition integration to certification-ready documentation, we can streamline your validation workflows.
Contact me to discuss automation opportunities in your testing lab or quality control process.