A fully automated ETL system that maintains 35 years of historical stock data across 363 tickers, updating weekly without manual intervention.
CHALLENGE
I needed a reliable, automated source of historical stock market data for analysis.
Manually downloading data weekly was time-consuming and easy to forget. I wanted a local database that stayed current without manual intervention and could serve data on-demand for any analysis.
SOLUTION
Built a Python-based ETL pipeline that automatically pulls daily pricing data from the Yahoo Finance API and loads it into a SQL Server database structured as a star schema. Windows Task Scheduler runs the update script every Saturday, checking for the last available date per ticker and only requesting new data to avoid redundant API calls. The system handles 363 tickers with complete automation.
Key Technologies: Python (pandas, yfinance), SQL Server, Windows Task Scheduler, Star Schema Database Design
OUTCOME
The pipeline has run reliably for over a year, collecting and maintaining 3.2+ million daily price records across 363 tickers (averaging 35 years of history per ticker). The system updates automatically every Saturday without manual intervention, providing an always-current local data source for analysis. Eliminated the need to manually download data or rely on external APIs during analysis, enabling on-demand queries against decades of market history.
– TECHNICAL OVERVIEW –
System Architecture
The pipeline consists of four primary components working together:
1. Data Source (yfinance API) Provides historical daily OHLCV data for any ticker symbol, pulling directly from Yahoo Finance’s public datasets. Free access with reasonable rate limits makes it suitable for individual research and analysis.
2. Processing Layer (Python) processDailyData.py queries the database to identify the last date of available data for each ticker, then pulls all subsequent daily data through the present using yfinance. This incremental approach minimizes API calls and respects rate limits.
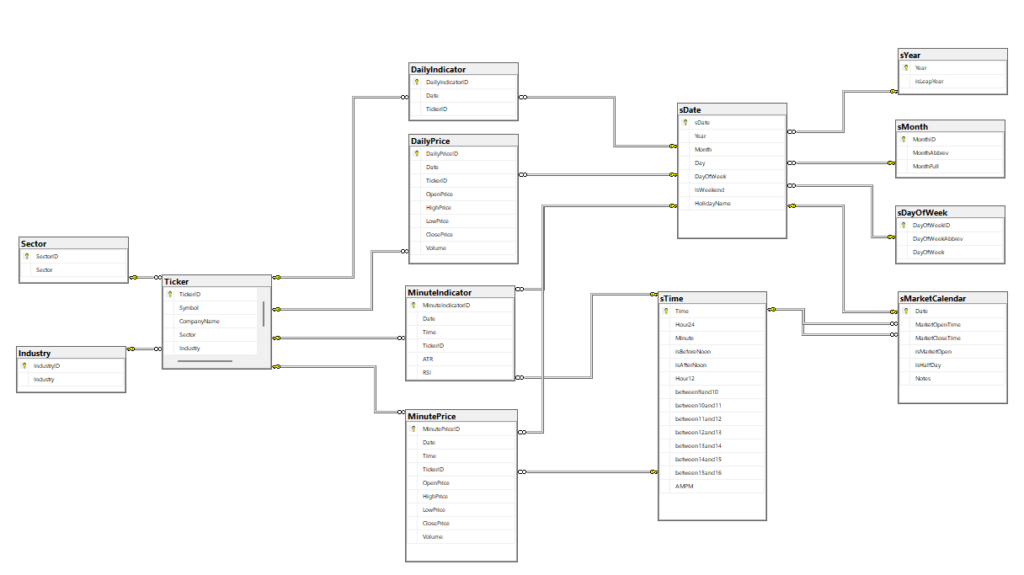
3. Storage Layer (SQL Server) Normalized database schema with separate fact tables for pricing data and dimension tables for tickers, sectors, industries, and dates. Unique constraints ensure no duplicate data entries.
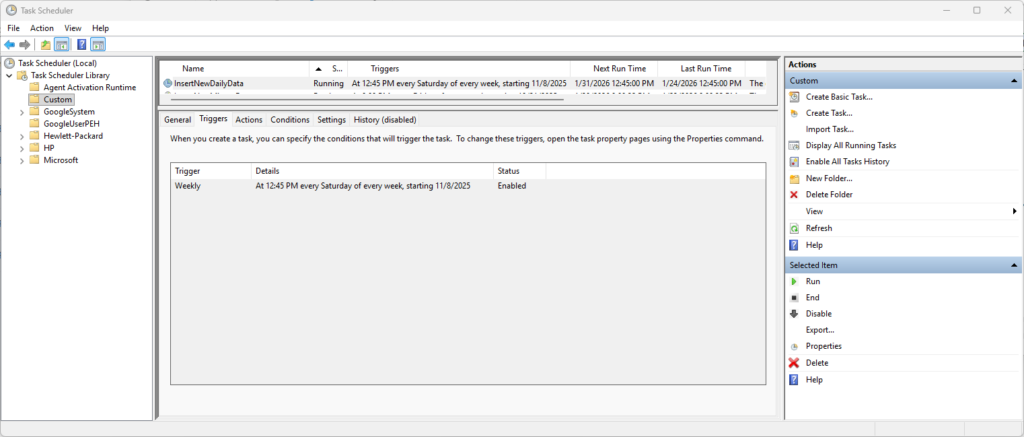
4. Automation Layer (Windows Task Scheduler) Executes processDailyData.py every Saturday during off-market hours. If a run fails (network issue, API downtime), the next Saturday’s execution picks up where it left off due to the incremental update logic.
Database Design
The database follows a dimensional modeling approach optimized for time-series queries:
Fact Tables (Pricing Data):
DailyPrice: Date, TickerID, Open, High, Low, Close, Volume
Dimension Tables:
Ticker: Symbol, CompanyName, Sector, Industry, isActivesDate: Date breakdown (Year, Month, Day, DayOfWeek, HolidayName)sMarketCalendar: Market open/close times, half-day indicators
This separation provides several advantages:
- Pricing data remains clean and minimal
- New tickers can be added without schema changes
- Time-based dimensions enable efficient filtering by trading days or specific time windows
- Supports fast joins for sector/industry analysis
Data Collection
One of the pipeline’s most valuable features is its incremental update logic. Rather than re-downloading entire histories daily, the script:
- Queries the database for the most recent date with pricing data for each ticker
- Calculates the next trading day using the market calendar dimension
- Only requests data from that date forward to the present
- Validates against unique constraints to prevent duplicate insertions
This approach minimizes API calls, reduces processing time, and respects rate limits on free data sources. For 363 tickers updated weekly, the difference between pulling 5 days versus 35 years is substantial.
# Example Code:
# Get last date in database for this ticker
last_date = query_last_date(ticker_id)

# Only fetch new data
new_data = yf.download(ticker, start=last_date + timedelta(days=1), end=today)

# Insert only new records
insert_new_records(new_data)
Parsing Complex Export Formats
While the daily data pipeline uses the clean yfinance API, the system also handles minute-level data exports from Thinkorswim’s Strategy Reports, which require significant parsing complexity.
The Challenge: the Thinkorswim exports contain:
- Six header rows of metadata that must be skipped
- Semicolon-delimited fields with inconsistent formatting
- Pipe-separated OHLCV data nested within parentheses
- DateTime strings requiring parsing and splitting into separate Date/Time fields
- “N/A” values requiring conversion to sentinel values
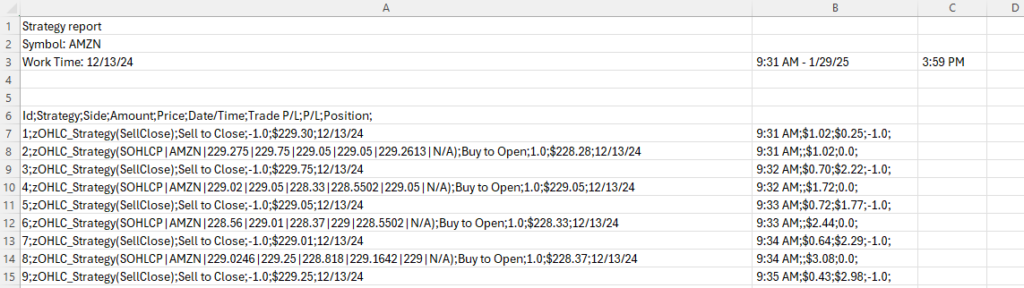
The Solution: The processMinuteData.py script systematically addresses each challenge:
# Extract only even-numbered rows containing actual data
if line_count % 2 == 0 and "kg_EveryTickSOHLCPV" in line:
    split_data_line = line.split(';')
    line_data = split_data_line[1]
    line_datetime = split_data_line[5]

    # Parse nested OHLCV data
    cleaned_line_data = line_data.split('(')[1].rstrip(')')
    split_line_data = cleaned_line_data.split('|')

    # Handle missing values
    openPrice = split_line_data[2]
    if openPrice == 'N/A':
        openPrice = '-1'
This type of format-specific parsing logic is common when working with proprietary exports, legacy systems, or equipment data loggers that weren’t designed with integration in mind. The ability to reverse-engineer undocumented formats and write robust parsers is a critical data engineering skill.
Automation Strategy
Task Scheduler Configuration:
- Trigger: Every Saturday at 8:00 PM (after market close, off-peak hours)
- Action: Run
python processDailyData.py - Conditions: Only run if network available
- Settings: Retry on failure (3 attempts, 10-minute intervals)
Error Handling:
- Network connectivity checks before API calls
- Graceful handling of delisted tickers
- Logging of all operations to
pipeline.log
Monitoring:
- Log file tracks: tickers processed, new records inserted, API errors, execution time
- Database includes
LastUpdatedtimestamp per ticker for manual verification
Technical Challenges Solved
Challenge 1: Handling Market Holidays The sMarketCalendar dimension table stores all market holidays (Thanksgiving, Christmas, Good Friday, etc.). The script validates dates against this calendar to avoid requesting data for non-trading days.
Challenge 2: Data Validation Before inserting records, the script validates:
- Price fields are numeric and non-negative
- Volume is a positive integer
- Date falls within reasonable range (not future dates)
- OHLC relationship is logical (High >= Open/Close, Low <= Open/Close)
Challenge 3: Duplicate Prevention SQL Server unique constraints on (Date, TickerID) prevent duplicate entries. If the script attempts to insert an existing record (e.g., after a failed run), the database rejects it and continues processing.
Challenge 4: Delisted/Merged Tickers The Ticker table includes an isActive flag. When a ticker is delisted or merged, the script marks it inactive but preserves historical data for analysis. The update script skips inactive tickers to avoid unnecessary API calls.
Performance Metrics
Database Statistics (as of current date):
- 363 active tickers
- 3,263,835 daily price records
- Average 8,991 days (35 years) of history per ticker
- Database size: ~2384.00 MB
Pipeline Execution:
- Average runtime: <5 minutes (363 tickers, ~5 new days per week)
- API calls per run: ~363 (one per ticker, incremental updates only)
- Success rate: >99% (failures due to network/API issues, auto-recover next run)
Use Cases Enabled
This data pipeline supports multiple analytical workflows:
- Backtesting Trading Strategies: Query decades of price history to test technical indicators, momentum strategies, or mean reversion across hundreds of stocks.
- Statistical Analysis: Calculate rolling correlations, volatility metrics, or sector performance trends using SQL queries or Python pandas.
- Machine Learning: Export clean, structured data for training predictive models without manual data preparation.
- Portfolio Analysis: Track historical performance of custom portfolios, calculate Sharpe ratios, or analyze drawdown periods.
Future Enhancements
Potential expansions under consideration:
- Fundamental Data Integration: Add earnings, P/E ratios, revenue data from financial APIs
- Alternative Data Sources: Diversify beyond yfinance (Alpha Vantage, Polygon.io) for accuracy
- Web Dashboard: Flask or Streamlit interface for querying and visualizing data
Lessons Learned
1. Local Infrastructure Has Value Cloud services offer convenience, but for personal analytical projects, local SQL Server provides zero ongoing costs, complete control, and no data residency concerns.
2. Incremental Updates Are Critical Pulling only new data respects API rate limits and makes the pipeline sustainable long-term. Full historical re-downloads would be unsustainable.
3. Star Schema Pays Dividends Initial time spent designing the dimensional model paid off immediately. Queries that would require complex joins in a normalized schema become simple and fast.
4. Automation Requires Intense Error Handling A script that works perfectly when manually executed can fail silently when automated. Logging, validation, and retry logic are non-negotiable.