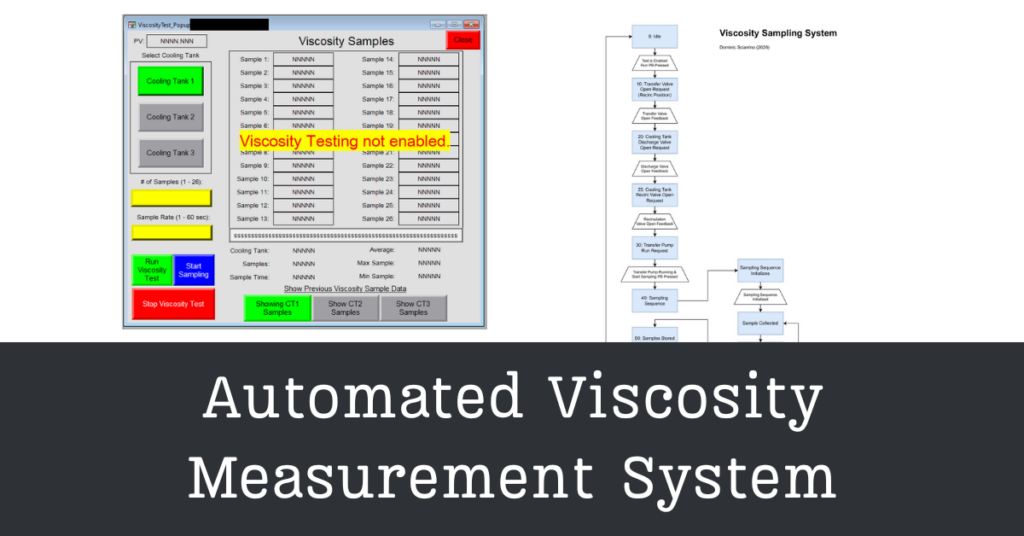
A fully automated viscosity testing system that reduced testing time from 60 minutes to 8 minutes per cycle through integrated PLC control and HMI interface.
CHALLENGE
A materials manufacturing facility producing fibrous materials needed frequent viscosity testing across three cooling tanks to ensure product quality.
The manual testing process required operators to collect samples, transport them to testing equipment, and manually record results – consuming approximately one hour per test cycle.
With testing required at least once daily (and often more frequently during production runs), this manual approach created significant operational inefficiencies, extended labor time, delayed feedback on material properties, and introduced potential for inconsistent sample collection.
SOLUTION
Designed and implemented an automated viscosity measurement system integrating a TT100 viscometer (4-20mA analog output) with the existing Allen Bradley ControlLogix PLC and updated the Panelview Plus 7 HMI.
Three recirculation ball valves and a transfer pump were added to enable automated sample circulation.
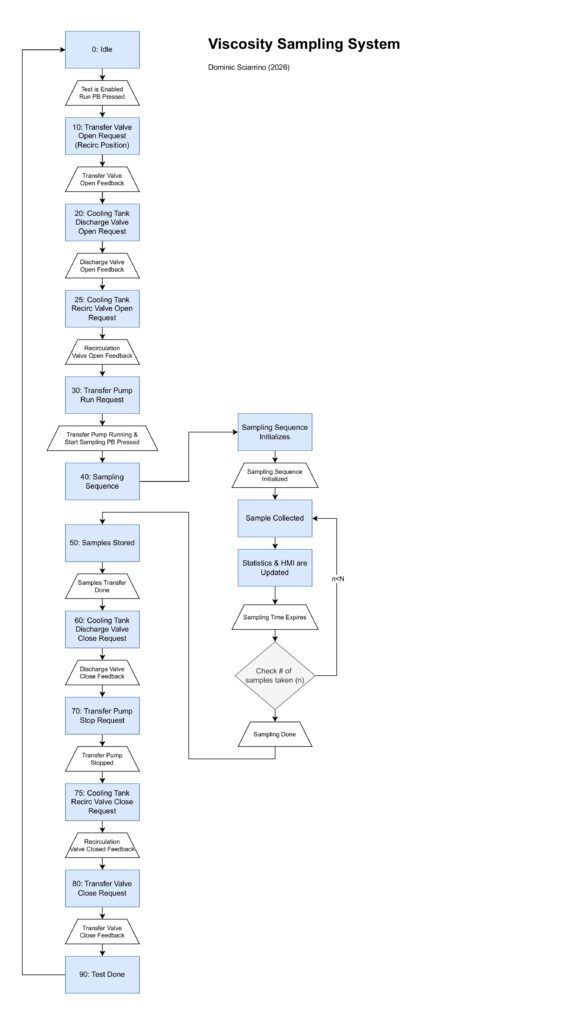
The system operates via simple sequential control: operator initiates the test from an HMI popup screen, confirms uniform flow through the viscometer section, then starts automated sample collection. The PLC collects a preconfigured number of samples, calculates basic statistics (min, max, average), and displays results on the HMI. Safety interlocks ensure valve position confirmation before pump start and proper sequencing throughout the cycle.
Key Technologies: Allen Bradley ControlLogix PLC (Studio 5000), Panelview Plus 7 HMI (FactoryTalk View ME), Analog Signal Integration (4-20mA), Sequential Control Logic, Safety Interlocks
OUTCOME
Reduced viscosity testing time from 60 minutes to 8 minutes per cycle (87% reduction). With testing conducted at least once daily across production runs, this translates to approximately 200+ labor hours saved annually.
The automation delivered consistent sample collection methodology that eliminated variability, provided single-button operation from the HMI, freed operators to focus on other critical tasks, and enabled real-time visibility into fluid quality for faster production decisions.
– TECHNICAL OVERVIEW –
System Architecture
The automated viscosity measurement system integrates seamlessly into the existing control architecture, adding measurement capability without disrupting normal production operations.
Hardware Components:
Measurement:
- TT100 Viscometer with 4-20mA analog output
- Analog input module on ControlLogix PLC for signal acquisition
Flow Control:
- Three recirculation ball valves (automated actuation)
- Transfer pump (variable speed or on/off control)
- Proximity sensors for valve position feedback
Control & Interface:
- Allen Bradley ControlLogix PLC (existing platform)
- Panelview Plus 7 HMI (updated with new popup screen)
- Studio 5000 for PLC programming
- FactoryTalk View ME for HMI development
Control Philosophy
The system balances full automation with operator judgment. Rather than running completely autonomously, it requires operator confirmation at a critical checkpoint before proceeding with sample collection.
Operational Sequence:
- Operator Initiation: Press “Test Viscosity” button on HMI
- Popup Display: Dedicated screen shows all controls and real-time information
- System Preparation: “Run” button initiates automated valve movement and pump start
- Flow Verification: Operator visually confirms no leaks and uniform flow through viscometer section
- Sample Collection: Operator starts automated sampling procedure
- Statistical Analysis: PLC collects N samples and calculates statistics (min, max, average, standard deviation)
- Results Display: Statistics appear on HMI popup in real-time
- Manual Recording: Operator transcribes results to manual checklist (per customer workflow)
- System Reset: Automated return to initial process configuration
Design Rationale:
The operator flow verification step (Step 4) addresses a legitimate concern: verifying the physical integrity of the temporary test configuration before committing to sample collection. While this could theoretically be automated with additional flow sensors, the customer preferred a human checkpoint at this stage to catch any unexpected conditions.
Analog Signal Integration
The TT100 viscometer’s 4-20mA output provides reliable, noise-resistant viscosity measurement over standard industrial wiring distances.
Analog Input Configuration:
- PLC analog input module configured for 4-20mA current loop
- 4mA = minimum viscosity range
- 20mA = maximum viscosity range
Scaling to Engineering Units: The PLC converts the raw 4-20mA signal to meaningful viscosity units (typically centipoise or Pascal-seconds) based on the viscometer’s calibration data:
Viscosity = ((Analog_Input - 4) / 16) × (Max_Visc - Min_Visc) + Min_ViscThis scaling allows operators to see viscosity in familiar units rather than raw sensor values, improving usability and reducing interpretation errors.
Safety Interlocks and Conditional Logic
The system implements multiple safety interlocks to prevent equipment damage and ensure operator safety.
Transfer Valve Position Confirmation:
Before starting the recirculation pump, the PLC verifies that all three ball valves have reached their commanded positions via proximity sensor feedback. If any valve fails to confirm position within 20 seconds, the sequence halts and an alarm is triggered.
Discharge Valve State Verification:
The system confirms the discharge path is open before initiating material flow. This prevents deadheading the pump, which could cause pressure buildup or equipment damage.
Cooling Tank Recirculation Valve Status:
The PLC monitors the recirculation valve state to ensure the cooling tank remains in proper circulation mode during the test sequence.
Pump Interlock Logic:
The transfer pump can only start when all three prerequisite conditions are met:
- All valves at commanded positions
- Discharge path confirmed open
- No active alarm conditions
These interlocks are not optional or bypassable by operators. They represent hard-coded safety logic that executes regardless of operator input.
HMI Design: Usability and Workflow Integration
The Panelview Plus 7 HMI update focused on seamless integration with the existing operator interface while providing dedicated viscosity testing functionality.
Popup Screen Architecture:
Rather than adding a new permanent screen to the navigation structure, viscosity testing is accessed via a popup window. This keeps the testing interface contextual (appears only when needed) while maintaining the familiar main screen layout operators already know.
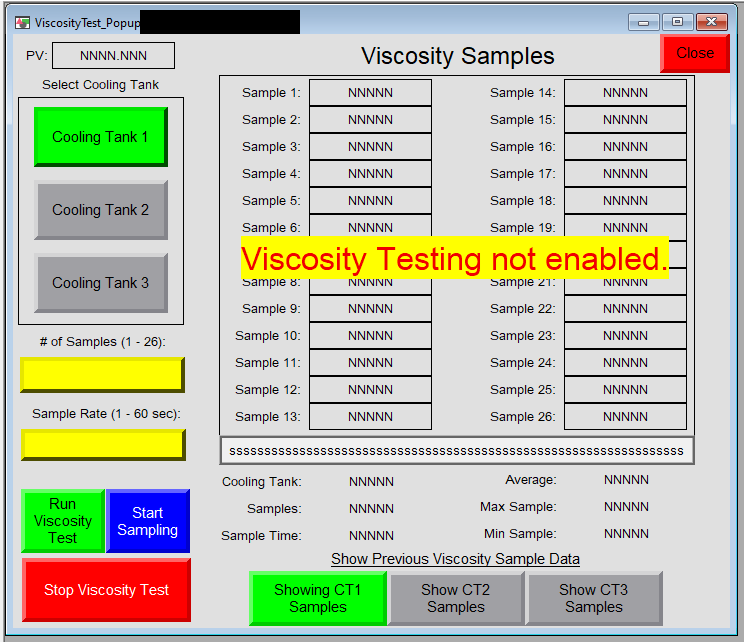
Primary Controls (left section):
- PV (Process Value): Live viscosity reading
- Tank Selection buttons: Selects the tank-under-test
- # of Samples: the number of samples to measure from the TT100
- Sample Rate: the sampling period in seconds
- “Run” button (initiates valve/pump sequence)
- “Start Sampling” button (begins automated sample collection after visual flow verification by operator)
- “Stop/Abort” button (returns system to safe state)
Real-Time Status (right/main section):
- Sampled viscosity readings (live updating during circulation)
Statistical Results (bottom section):
- Minimum viscosity value
- Maximum viscosity value
- Average viscosity
- Sample count used for calculations
- Sample time & Selected Cooling Tank
Three-Click Operation:
From the operator’s perspective, the entire test requires only three interactions:
- Press “Test Viscosity” (opens popup)
- Press “Run” (starts sequence)
- Press “Start Sampling” after visual flow verification
Everything else happens automatically.
Data Management and Historical Tracking
Current Implementation:
The PLC retains the most recent test results in memory, allowing operators to recall the last viscosity measurement if needed for reference or if transcription to the manual checklist was interrupted.
Manual Recording Workflow:
Per customer request, test results are manually transcribed from the HMI to a paper checklist. While this may seem inefficient, it reflects the facility’s existing quality management system and document control procedures. Changing to automated data logging would require updates to their QMS documentation and validation procedures.
Future Enhancement Potential:
The system architecture supports straightforward expansion to automated historian logging. Adding data collection would require:
- Configuring FactoryTalk Historian or similar trending software
- Mapping viscosity tags to historian data points
- Implementing timestamp logging for each test cycle
- Building trend displays for long-term viscosity pattern analysis
This capability was not requested for the initial implementation but represents a low-effort upgrade path if the customer’s data management requirements evolve.
Measurable Results
Time Savings:
- Before: 60 minutes per test cycle (manual sample collection, transport, testing, recording)
- After: 8 minutes per test cycle (automated sequence with operator oversight)
- Reduction: 52 minutes per test = 87% time savings
Annual Impact:
- Testing frequency: Minimum once daily, often more during active production runs
- Conservative estimate: 250 test cycles per year (accounting for non-production days)
- Annual time savings: 250 tests × 52 minutes = 13,000 minutes = 217 hours per year
- Labor cost savings: 217 hours × average operator wage = significant annual ROI
Process Improvements:
- Consistency:
Automated valve sequencing and pump control eliminate the variability introduced by different operators following manual procedures. Every test follows identical timing, flow conditions, and sample collection methodology.
- Real-Time Feedback:
Operators now see viscosity results within 8 minutes instead of waiting up to an hour. This enables faster response to process deviations and reduces the window where off-spec material might be produced.
- Operator Productivity:
Freed from the manual testing workflow, operators can focus on process monitoring, quality checks, and other value-added activities rather than repetitive sample handling.
- Reduced Error Risk:
Manual transcription is limited to a single step (HMI to checklist) rather than multiple handoffs during sample transport and testing, reducing opportunities for recording errors.
Design Considerations for Similar Applications
This viscosity measurement project exemplifies several best practices applicable to other industrial automation integration tasks:
1. Leverage Existing Infrastructure
By integrating with the existing ControlLogix PLC platform and Panelview Plus 7 HMI, the project minimized training requirements, maintenance complexity, and cost.
2. Design for Maintainability
The sequential step structure in the PLC program allows for straightforward troubleshooting:
- Each step has clear entry/exit conditions
- Maintenance personnel can easily identify where a sequence stopped if a fault occurs
3. Prioritize Safety Through Interlocks
Multiple confirmation steps and valve position feedback ensure:
- Equipment protection (pump never starts with closed valves)
- Operator safety (no unexpected equipment movement)
- Process integrity (proper flow path before sample collection)
Technical Challenges Solved
Challenge 1: Analog Signal Noise in Industrial Environment
Industrial facilities generate significant electrical noise (VFDs, motors, switching power supplies). The 4-20mA current loop inherently rejects noise better than voltage signals, but additional measures were still necessary:
Solution:
- Twisted-pair shielded cable for viscometer wiring
- Proper grounding at PLC analog input module
- Moving average filter in PLC code (smooths transient spikes)
Challenge 2: Valve Position Timing Variability
Ball valves don’t actuate instantaneously. Depending on line pressure, valve age, and actuator condition, movement time can vary from 5 to 20 seconds.
Solution:
- Proximity sensors provide definitive position feedback
- PLC logic uses position confirmation rather than fixed time delays
- 20-second timeout protects against stuck valves while accommodating normal variability
Challenge 3: Sample Size Determination
Too few samples yield unreliable statistics. Too many samples extend test time unnecessarily.
Solution:
- Configurable sample count (N) stored in PLC memory
- Operator-adjustable via HMI settings
Lessons Learned
Simplicity Wins
The initial design concept included multiple automated quality checks, alarms for out-of-range viscosity. The customer simplified this to the current implementation: run the test, display the results, let the operator decide. This reduced complexity, eliminated potential false alarms, and kept operators in control of process decisions.
Phased Implementation Reduces Risk
Rather than attempting to automate all three cooling tanks simultaneously, the system was developed and validated on Tank 1 first. After a couple days of reliable operation, the implementation was replicated to Tanks 2 and 3. This phased approach allowed for:
- Real-world validation before broader deployment
- Operator training on a single system first
- Identification of edge cases and refinements before scaling