A comprehensive machine learning analysis testing whether conventional RSI threshold wisdom (30/70) holds up across 500 stocks and 25 years of market data.
CHALLENGE
Technical analysts rely heavily on the Relative Strength Index (RSI) with conventional 30/70 thresholds to identify overbought and oversold conditions.
However, most resources promoting these thresholds show cherry-picked examples rather than rigorous statistical evidence.
For my Masters AI for Investment course, I wanted to test whether these assumptions hold up when evaluated systematically across hundreds of stocks, multiple threshold configurations, and varying time horizons.
SOLUTION
Built a comprehensive data science pipeline analyzing ~500 S&P 500 stocks with daily OHLCV data from 2000 to present (2.6+ million observations).
Engineered 20 RSI threshold features (10/15/20/25/30 and 70/75/80/85/90, both upward and downward crossings) and calculated forward-looking returns for 1-25 day holding periods.
Applied logistic regression and random forest ensemble models to extract feature importance and regression coefficients, revealing relationships between RSI triggers and subsequent return patterns.
Created multi-dimensional visualizations (heatmaps, probability distributions, return trajectories) to make complex patterns accessible.
Key Technologies: Python (pandas, scikit-learn, seaborn, matplotlib, plotly), SQLite, Machine Learning (Logistic Regression, Random Forest), Feature Engineering, Statistical Analysis
OUTCOME
The analysis revealed that conventional 30/70 thresholds are not universally optimal.
RSI_BELOW_25 showed the most consistent positive directional relationship across time horizons, while RSI_ABOVE_75 demonstrated strong negative coefficients for short-term (0-13 day) predictions.
Probabilistic analysis showed virtually no threshold achieved high success probability within 2 weeks when used in isolation, but probability increased significantly for holding periods beyond 14 days.
The project demonstrated how systematic data science methodology can transform accepted trading wisdom from anecdotal evidence into quantified, nuanced understanding.
– TECHNICAL OVERVIEW –
Background: What is RSI?
The Relative Strength Index (RSI), developed by J. Welles Wilder Jr. in 1978, serves as one of the most widely utilized momentum oscillators in technical analysis. Often described as a “speedometer” for stock prices, RSI measures price changes to identify overbought and oversold conditions.
The RSI calculation produces values ranging from 0 to 100:
- High numbers (70-100): Stock has been rising significantly – potentially “overbought”
- Low numbers (0-30): Stock has been falling significantly – potentially “oversold”
- Middle numbers (~50): Price movements have been fairly balanced
Traditional wisdom: Buy when RSI crosses above 30 (exiting oversold), sell when RSI crosses below 70 (exiting overbought).
The fundamental question: Does this actually work across diverse stocks and market conditions?
Research Question
Can RSI crossover signals reliably predict future stock returns across a large, diverse set of stocks when evaluated across multiple threshold configurations?
Specifically, this project challenges the conventional 30/70 threshold paradigm by systematically testing alternative thresholds (10, 15, 20, 25, 30 and 70, 75, 80, 85, 90) and their effectiveness across varying holding periods (1-25 days).
Data Collection & Preparation
Data Source:
Daily OHLCV (Open, High, Low, Close, Volume) data for approximately 500 S&P 500 stocks spanning from 2000 to August 2025, totaling over 2.6 million individual observations.
Collection Method:
Data acquired using the yfinance Python library, which provides reliable access to historical stock price data from Yahoo Finance. Data was initially extracted into individual CSV files, then consolidated into a SQLite database for efficient querying and management.
Ethical Considerations:
The use of publicly available historical stock price data raises minimal ethical concerns. However, the analysis includes a clear disclaimer: any trading strategies derived from this analysis should be implemented with proper risk management. Past performance does not guarantee future returns.
Feature Engineering: RSI Calculation & Threshold Triggers
RSI Calculation:
RSI values were calculated using the standard 14-day lookback period following Wilder’s original formula:
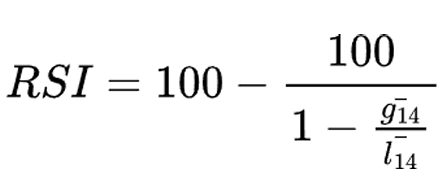
Where:
- g₁₄ = average gains over a 14-day period
- l₁₄ = average losses over a 14-day period
Threshold Features:
Binary trigger variables were created for each threshold crossing in both directions:
Oversold Thresholds: 10, 15, 20, 25, 30
Overbought Thresholds: 70, 75, 80, 85, 90
This resulted in 20 distinct RSI threshold indicators:
RSI_BELOW_X(upward crossings – buying signal)RSI_ABOVE_X(downward crossings – selling signal)
Forward-Looking Returns:
For each threshold trigger, calculated returns from buying at the opening price the day following the trigger and holding for 1-25 days. This simulates realistic trading where signals generate after market close and execution happens the next morning.
Machine Learning Models
Logistic Regression Models:
- Built one model per time horizon (25 models total)
- Target variable: Whether x-day return exceeded zero (binary classification)
- Features: All 20 RSI threshold indicators
- Purpose: Extract directional relationships (positive/negative coefficients indicate predicted return direction)
Random Forest Ensemble Models:
- Built one model per time horizon (25 models total)
- Same target and features as logistic regression
- Purpose: Capture non-linear relationships and extract feature importance scores
- Standard scikit-learn implementation (out-of-the-box parameters)
Tools Used:
- Visualization: seaborn, plotly, matplotlib
- Data Handling: pandas
- Machine Learning: scikit-learn
- Database: SQLite (with DB Browser for management)
Analysis Results
1. Signal Frequency Analysis
The frequency analysis revealed a fundamental trade-off: extreme thresholds (10/90) generated only hundreds of signals across the entire dataset, while conventional 30/70 thresholds produced over 105,000 occurrences.
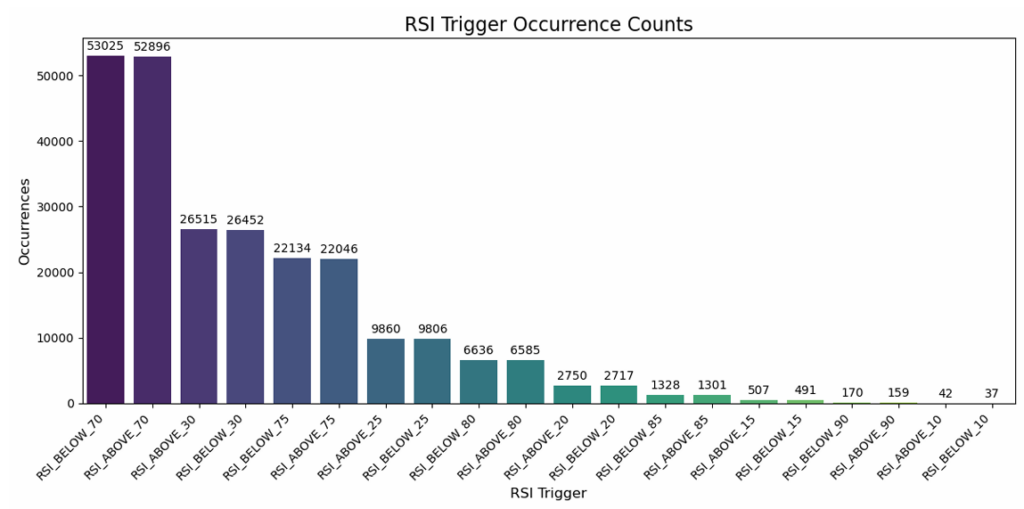
Key Insight: More extreme thresholds may offer stronger predictive signals, but at the cost of far fewer trading opportunities. This explains why 30/70 gained popularity – they provide frequent actionable signals.
2. Logistic Regression Coefficient Analysis
The heatmap visualizations revealed clear demarcation zones:
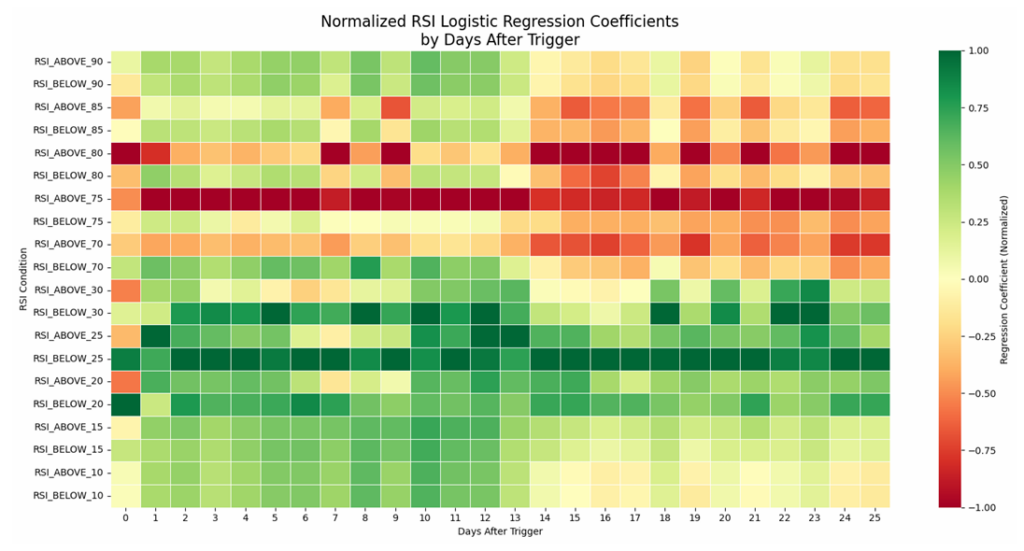
Negative Directional Relationship (RSI ≥ 70):
RSI_ABOVE_75showed strongest negative coefficients for 0-13 day horizons- After 13 days, negative coefficients shifted toward
RSI_ABOVE_80
Positive Directional Relationship (RSI ≤ 30):
RSI_BELOW_25demonstrated most consistent positive coefficients across all time horizonsRSI_BELOW_30also showed strong positive relationships for 0-13 day periods
Temporal Pattern:
Upper thresholds (≥70) held stronger predictive power for short-term horizons (0-13 days), while lower thresholds (≤30) maintained predictive strength across both short and long-term horizons.
3. Random Forest Feature Importance
RSI_ABOVE_70 and RSI_ABOVE_75 achieved the highest and most consistent feature importance scores across nearly all time horizons.
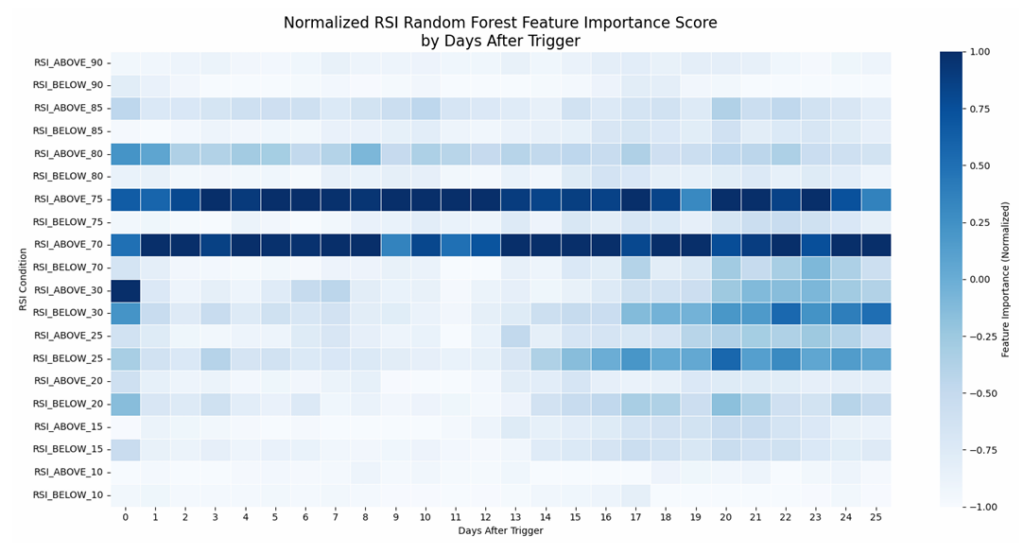
Interesting finding: After normalization, RSI_ABOVE_30 had the highest feature importance for the day immediately following the trigger, suggesting immediate market reaction to this threshold.
Temporal Dynamics:
- 0-13 days: Upper threshold levels showed higher importance scores
- 14-25 days: Lower threshold levels gained relative importance
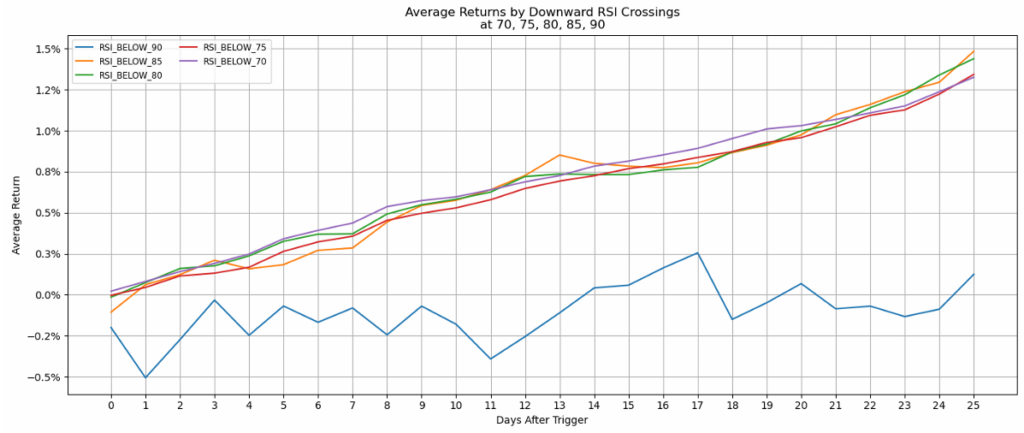
4. Returns Analysis
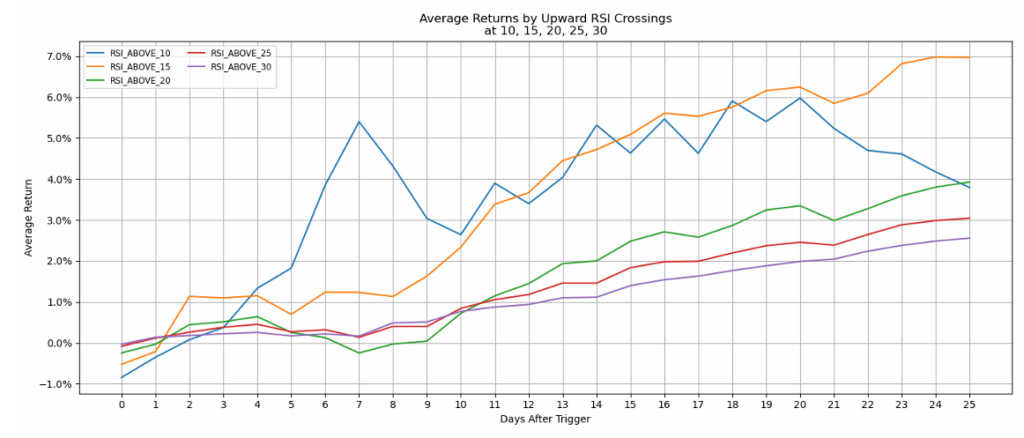
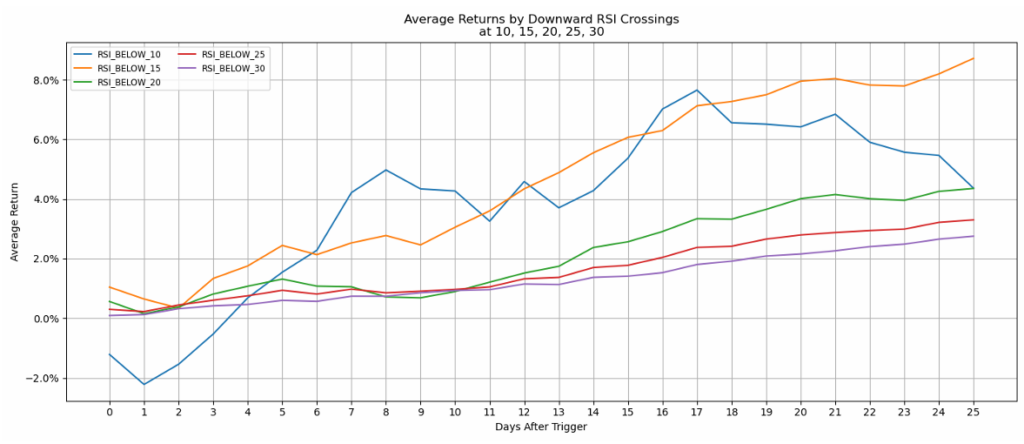
Oversold Levels (10-30):
- Downward crossings (crossing below the threshold) showed higher average returns
RSI_BELOW_10achieved 7-8% average returns over 25 days- However, this threshold triggered only rarely
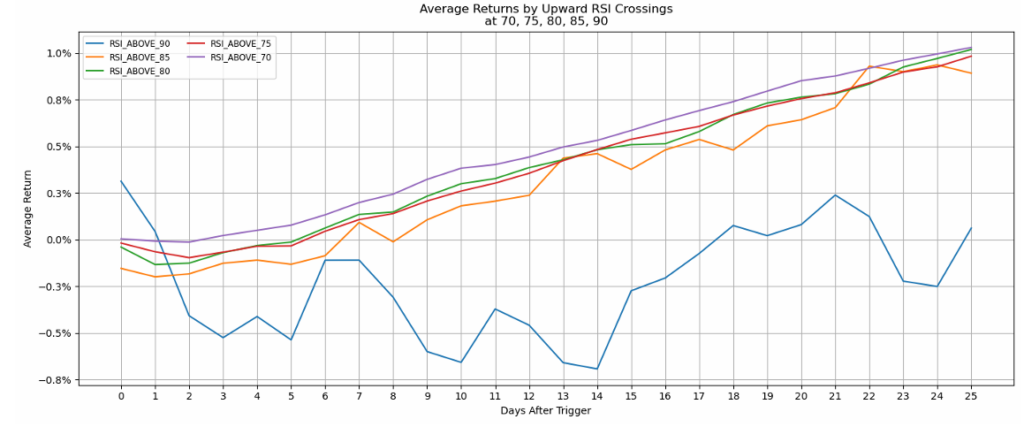
Overbought Levels (70-90):
- Upward crossings (crossing above the threshold) showed lowest returns
RSI_ABOVE_90displayed erratic, generally negative returns – most consistent level for short positions- More moderate thresholds (70-75) showed gradually improving returns over longer periods
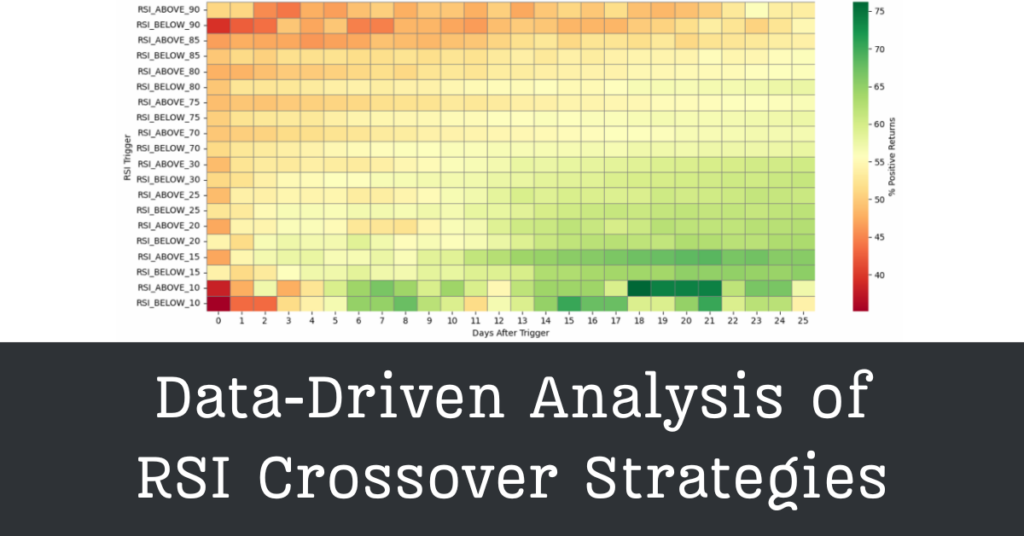
5. Probabilistic Analysis
The probability heatmap revealed a sobering reality: virtually no threshold achieved high success probability within 2 weeks when RSI signals were used in isolation.
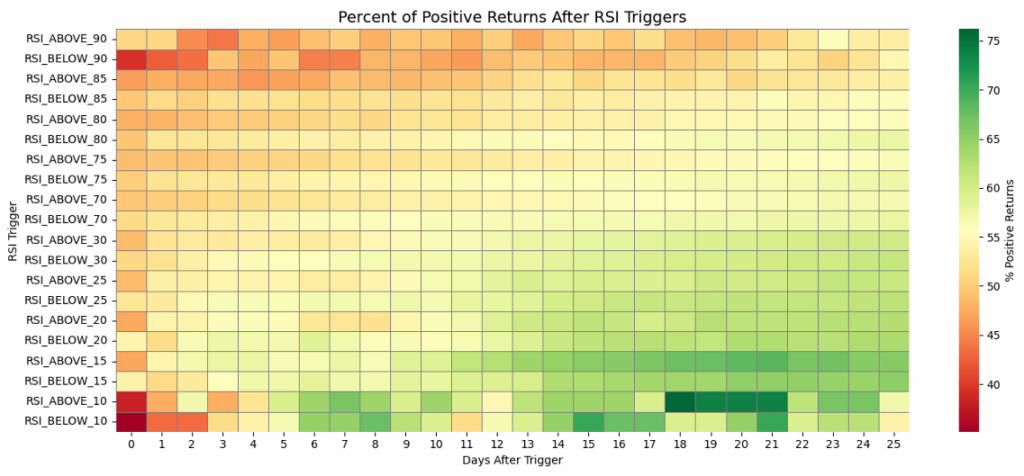
Key Findings:
- Probability of positive returns drifted upward only after 14+ day holding periods
RSI_BELOW_10showed highest success probability at 18 days post-trigger (~65%)RSI_ABOVE_90consistently showed poor probability across all time horizons
Implication: RSI should not be used as a standalone signal for short-term trading. Longer holding periods or combination with other indicators is necessary.
Limitations & Future Improvements
Survivorship Bias:
The dataset includes only stocks that survived 20+ years. Delisted/bankrupt stocks are excluded, potentially inflating apparent success rates. Future analysis should incorporate defunct ticker data.
Multiple Crossings in One Day:
Rare cases where RSI crossed multiple thresholds in a single day (e.g., 31→22 crosses both 30 and 25) were not specifically accounted for. This could be refined in future iterations.
Isolation Testing:
This analysis evaluated RSI in isolation. Real-world trading strategies combine multiple indicators. Future work could test RSI in conjunction with volume, moving averages, or MACD.
Broader Applications: Data Science for Decision Support
While this project focused on technical analysis, the methodology demonstrates how data science creates value across domains:
The Pattern:
- Identify conventional wisdom based on anecdotal evidence
- Collect comprehensive historical data
- Engineer relevant features
- Apply machine learning to extract patterns
- Visualize results for accessibility
- Acknowledge limitations transparently
Conclusions
Key Takeaways:
- The 30/70 convention is not universally optimal. Alternative thresholds showed stronger relationships for specific time horizons.
- RSI_BELOW_25 is underappreciated. It demonstrated the most consistent positive directional relationship across all holding periods.
- Time horizon matters. Upper thresholds (≥75) excel for short-term prediction (0-13 days), while lower thresholds (≤25) maintain predictive strength across both short and long periods.
- RSI alone is insufficient for short-term trading. No threshold achieved high success probability within 2 weeks when used in isolation.
- Systematic analysis beats cherry-picked examples. Testing across 500 stocks and 2.6M observations revealed nuances invisible in single-stock case studies.
Academic Outcome:
This project received strong marks in the AI for Investment course and validated my belief that rigorous data science methodology can challenge and refine accepted financial practices.
Personal Outcome:
Demonstrated that my curiosity about questioning assumptions, combined with technical data science skills, can produce meaningful insights. This project reinforced my commitment to evidence-based decision-making over conventional wisdom.
━━━━━━━━━━━━━━━━━━━━━━━━━━━━━━━━━━━━━━━━━
IMPORTANT DISCLAIMER
This analysis examines historical patterns in technical indicators for educational and research purposes only. Nothing in this discussion should be construed as investment advice or trading recommendations. Past performance does not guarantee future results. Any trading strategies should be implemented with proper risk management and understanding of market volatility.