
Cloud services and SaaS platforms dominate today’s data landscape, but there’s compelling value in building automated data pipelines on your own local infrastructure. Whether you’re tracking financial markets, monitoring manufacturing equipment, analyzing customer behavior, or collecting sensor data, a well-designed local pipeline provides control, cost efficiency, and customization that hosted solutions often cannot match.
This post explores the architecture and advantages of local data pipelines through a practical example: an automated stock market data collection system built with Python and SQL Server. While the example focuses on financial data, the principles and benefits apply across industries—from quality control in manufacturing to IoT sensor networks in facilities management.
IMPORTANT DISCLAIMER: The stock market data pipeline discussed here is for educational and research purposes only. Nothing in this discussion should be construed as investment advice or trading recommendations.
The Architecture: Python + SQL Server + Task Scheduler
System Overview
The pipeline consists of three primary components working in concert:
1. Data Sources
- yfinance API: Provides historical daily OHLCV (Open, High, Low, Close, Volume) data for any ticker symbol, pulling directly from Yahoo Finance’s public datasets
- Thinkorswim Platform: Exports minute-by-minute pricing data with technical indicators (RSI, ATR) pre-calculated via custom Thinkscript strategies
2. Processing Layer (Python)
- processDailyData.py: Queries the database to identify the last date of available data for each ticker, then pulls all subsequent daily data through the present using yfinance
- processMinuteData.py: Parses proprietary CSV exports from Thinkorswim, extracting OHLCV data and technical indicators from complex semicolon-delimited format
3. Storage Layer (SQL Server)
- Normalized database schema with separate fact tables for pricing (MinutePrice, DailyPrice) and indicators (MinuteIndicator, DailyIndicator)
- Dimension tables for tickers, sectors, industries, dates, times, and market calendars
- Unique constraints ensure no duplicate data entries
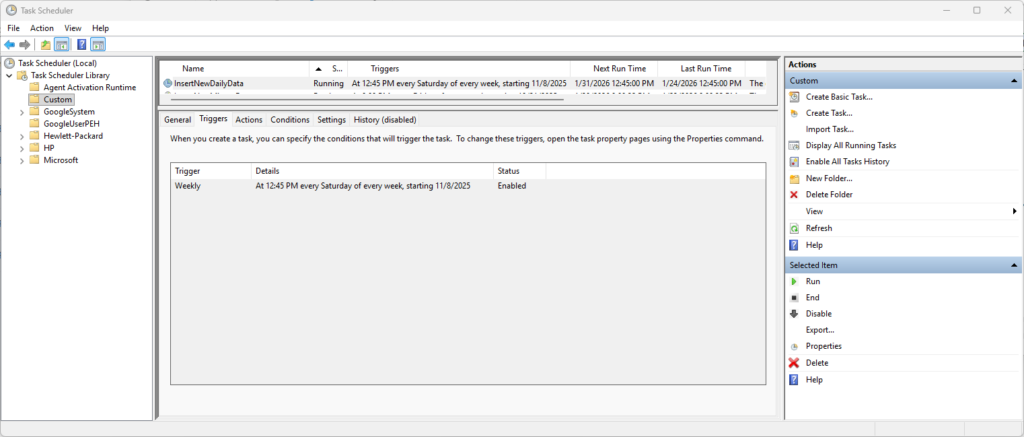
4. Automation Layer (Windows Task Scheduler)
- Daily execution of processDailyData.py during off-market hours
- Scheduled execution of processMinuteData.py after manual Thinkorswim exports
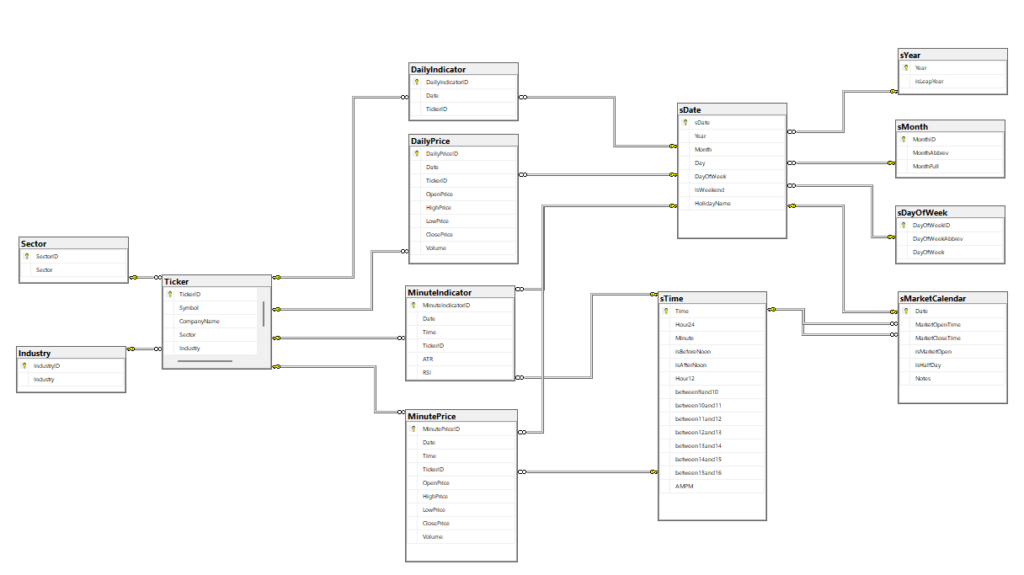
Database Design: Star Schema for Time-Series Analysis
The database architecture follows a dimensional modeling approach optimized for time-series queries:
Fact Tables (Pricing Data):
MinutePrice: Date, Time, TickerID, Open, High, Low, Close, Volume
DailyPrice: Date, TickerID, Open, High, Low, Close, Volume
MinuteIndicator: Date, Time, TickerID, ATR, RSI
DailyIndicator: Date, TickerID [extensible for additional indicators]
Dimension Tables:
Ticker: Symbol, CompanyName, Sector, Industry, isActive
sDate: Date breakdown (Year, Month, Day, DayOfWeek, HolidayName)
sTime: Time breakdown with market hour flags (between9and10, between10and11, etc.)
sMarketCalendar: Market open/close times, half-day indicators
This separation of concerns provides several advantages: pricing data remains clean and minimal, new indicators can be added without schema changes to price tables, and time-based dimensions enable efficient filtering by market hours, trading days, or specific time windows.
Intelligent Data Collection: Avoiding Redundancy
One of the pipeline’s most valuable features is its incremental update logic. Rather than re-downloading entire histories daily, the processDailyData.py script:
- Queries the database for the most recent date with pricing data for each ticker
- Calculates the next trading day using the market calendar dimension
- Only requests data from that date forward to the present
- Validates against unique constraints to prevent duplicate insertions
This approach minimizes API calls, reduces processing time, and respects rate limits on free data sources. For 500 tickers updated weekly, the difference between pulling 1 day versus 5,000 days is substantial.
Parsing Complex Export Formats
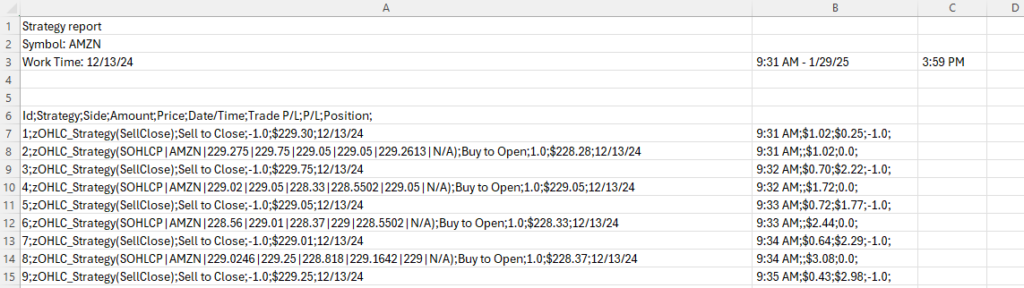
The processMinuteData.py script demonstrates ETL (Extract, Transform, Load) complexity handling. Thinkorswim exports contain:
- Six header rows of metadata that must be skipped
- Semicolon-delimited fields with inconsistent formatting
- Pipe-separated OHLCV data nested within parentheses
- DateTime strings requiring parsing and splitting into separate Date/Time fields
- “N/A” values requiring conversion to sentinel values
The script systematically addresses each challenge:
# Extract only even-numbered rows containing actual data
if line_count % 2 == 0 and "kg_EveryTickSOHLCPV" in line:
    split_data_line = line.split(';')
    line_data = split_data_line[1]
    line_datetime = split_data_line[5]

    # Parse nested OHLCV data
    cleaned_line_data = line_data.split('(')[1].rstrip(')')
    split_line_data = cleaned_line_data.split('|')

    # Handle missing values
    openPrice = split_line_data[2]
    if openPrice == 'N/A': openPrice = '-1'
This type of format-specific parsing logic is common when working with proprietary exports, legacy systems, or equipment data loggers that weren’t designed with integration in mind.
Key Advantages of Local Data Pipelines
1. Complete Data Ownership and Control
No Vendor Lock-In: Your data resides entirely on infrastructure you control. If a cloud provider changes pricing, discontinues a service, or experiences an outage, your pipeline continues operating independently. You’re not dependent on third-party uptime SLAs or subject to unexpected service changes.
Custom Schema Design: The database structure reflects your specific analytical needs. Need to add a new technical indicator? Create a new column. Want to track proprietary metadata? Add a dimension table. There’s no forcing your data into a predefined schema that doesn’t quite fit your use case.
Flexible Retention Policies: Keep minute-by-minute data for 10 years if that’s valuable for your analysis, or implement custom archival rules that move older data to cold storage. Cloud storage pricing often makes long-term, high-granularity retention prohibitively expensive.
2. Cost Efficiency at Scale
Predictable Infrastructure Costs: A local SQL Server installation (Express Edition is free for databases under 10GB, Standard Edition for larger needs) has no per-query pricing, no egress fees, and no surprise bills when usage patterns change. The hardware investment is one-time, and ongoing costs are limited to electricity and occasional maintenance.
API Rate Limit Management: By storing historical data locally, you only request new data from external APIs. This dramatically reduces API calls compared to repeatedly fetching the same historical data. For paid APIs with per-call pricing, this represents direct cost savings. For free APIs with rate limits, it prevents throttling and service interruptions.
Processing Cost Control: Compute resources for parsing, transforming, and loading data run on your own hardware. There’s no cloud function execution time billing, no container runtime costs, no lambda invocation charges. Processing intensive operations (calculating technical indicators across 20 years of minute data, for example) cost the same whether they take 1 minute or 10 hours.
3. Privacy and Security
Sensitive Data Protection: If you’re collecting proprietary operational data, customer information, or competitive intelligence, keeping it on local infrastructure reduces the attack surface. There’s no data in transit to cloud providers, no reliance on third-party security practices, and no regulatory concerns about data residency.
Audit Trail Control: You control all access logging, backup procedures, and recovery processes. For regulated industries or internal compliance requirements, this level of control simplifies audit preparation and ensures you can demonstrate data handling practices.
Conclusion
A local data pipeline can be a strategic asset that provides independence and quick data management. While cloud services offer convenience and scalability for certain use cases, there’s enduring value in owning your data collection, storage, and processing stack.
The stock market data pipeline demonstrates these principles in action: clean architecture, incremental updates, format-specific parsing, and automated execution. These same patterns apply whether you’re collecting sensor data from factory equipment, tracking website user behavior, monitoring environmental compliance, or analyzing any other time-series information source.
Need help designing and implementing automated data pipelines for your operational, research, or analytical needs? Whether you’re working with manufacturing equipment, IoT sensors, web analytics, or any other data source requiring collection, transformation, and structured storage, I can architect solutions that provide long-term value.
Contact me to discuss building data infrastructure that matches your organization’s analytical ambitions